Introduction
The spatial distribution of laying hens in cage-free houses is an indicator of flock’s health and welfare. While larger space allows chickens to perform more natural behaviors such as dustbathing, foraging, and perching in cage-free houses, an inherent challenge is evaluating chickens’ spatial distribution (e.g., real-time birds’ number on perches or in nesting boxes). Manual inspection of hen’s spatial distribution requires closer observation, which is labor intensive, time consuming, subject to human errors, and stress causing on birds. Therefore, an automated monitoring system is required to track the spatial distribution of hens for early detection of animal welfare and health concerns.
Methods
About 800 of day-old chicks (Hy-Line W-36) were raised in four research chamber rooms (each was measured as 7.3 m long × 6.1 m wide × 3 m high) at the Poultry Science Center at the University of Georgia (UGA). Cameras (Swann Communications, Santa Fe Spring, CA) were installed with two different angles (i.e., vertically and horizontally) to record the spatial distribution of birds (Figure 1). The recorded videos were transferred to massive hard devices for analyzing video quality and converting to JPG format in the Department of Poultry Science at UGA.
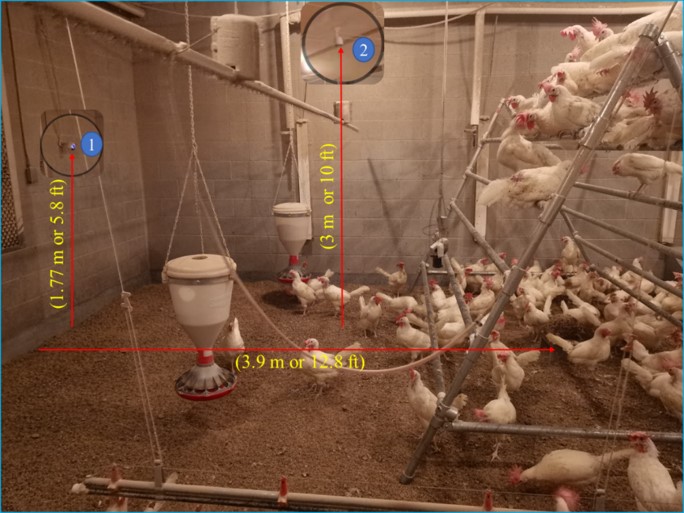
Figure 1.Experimental setup for collecting laying hens’ spatial distribution dataset.
In this study, an improved YOLOv5 model was developed for chicken detection. The architecture consisted of three parts, i.e., backbone, neck, and head. The improved YOLOv5 model is based on CNN network that can take in an input image and capture its spatial characters (learnable weights) to train the network to detect object. In this study, the Ghost was adopted to process hen’s feature maps (Figure 2). The original hen’s feature map is blurry after YOLOv5 neck network. However, with the Ghost module, the channel number of hen’s feature maps improved, and an enhanced hen’s feature pyramid developed.
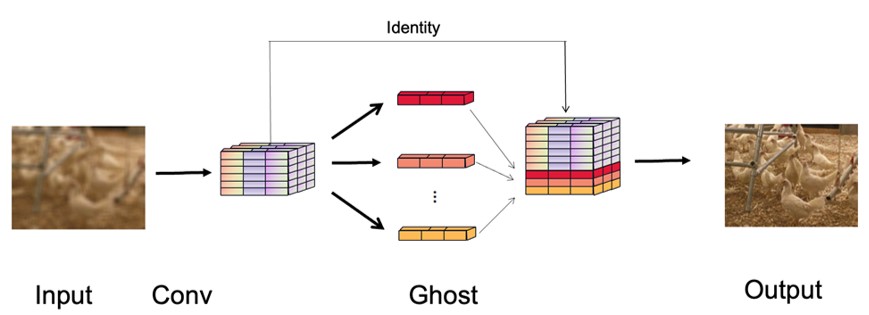
Figure 2. Module for processing poultry images.
Results
To evaluate the model performance and explore optimal setting parameters, the YOLOv5 – x method and several training parameters were applied. These parameters include image size (e.g., 640 and 320) and datasets (e.g., individual type dataset and mixed type dataset). Figure 3 shows the birds detected by improved YOLOv5 model. In the perching zone (Figure 3A), the model monitored perched chickens from 0 to 2.4 m and summed up them to three different levels (the number of hens in three levels were 7, 61, and 17 from bottom to top of the perch frame, respectively). For baby chicks’ perching (Figure 3B), there were 8 hardwood perching boards. The number of detected chicks in each perching board was 2, 3, 1, 5, 4, 1, 6 and 4, respectively, from far to close in the Figure 3B.
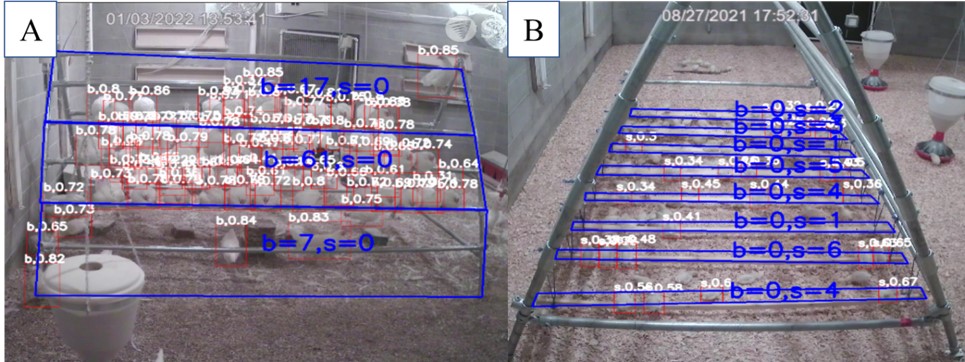
Figure 3. Chickens’ distribution in perching zones detected by improved YOLOv5. (A) adult hens (133 days of old) detected; (B) baby chicks detected (8 days of old). The letter b in blue means older birds (> 10 days old) and the letter s in blue represents baby chicks (≤ 10 days old).
Figure 4 demonstrates the distribution of detected birds in feeding zones. For each picture, the number of chickens in targeted areas were analyzed. From Figure 4, we can identify the distribution of baby chicks (i.e., 10 days old) in feeding zone in 100% accuracy.
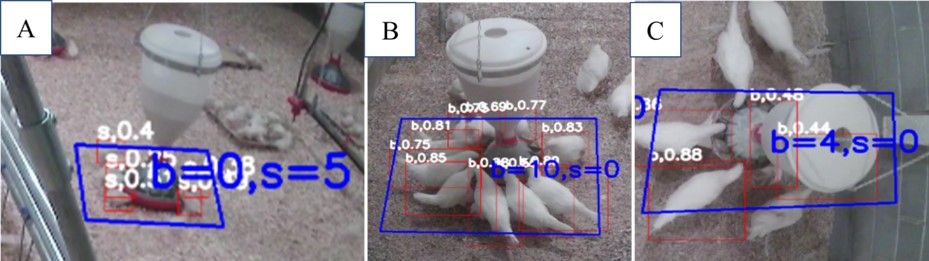
Figure 4. Chickens’ distribution in the feeding zone at different ages (A – chickens were 10 days old; B and C – chickens were 122 days old (b means birds were > 10 days; s means birds were ≤10 day).
In this study, most hens started to lay their first eggs at around 18 weeks of age. Hens’ nesting was analyzed with our newly developed model because it’s important to identify if there are floor eggs or not. Monitoring hens’ distribution in nesting zones helps to minimize losses from laying eggs on the floor. Figure 5 shows the distribution of detected hens in nesting zones with our improved YOLOv5 model. Figure 5A is the original image of nesting area. Figure 5B demonstrates the detected hens in nesting zone. The model performed with over 90% accuracy in detecting hens in nesting zones.
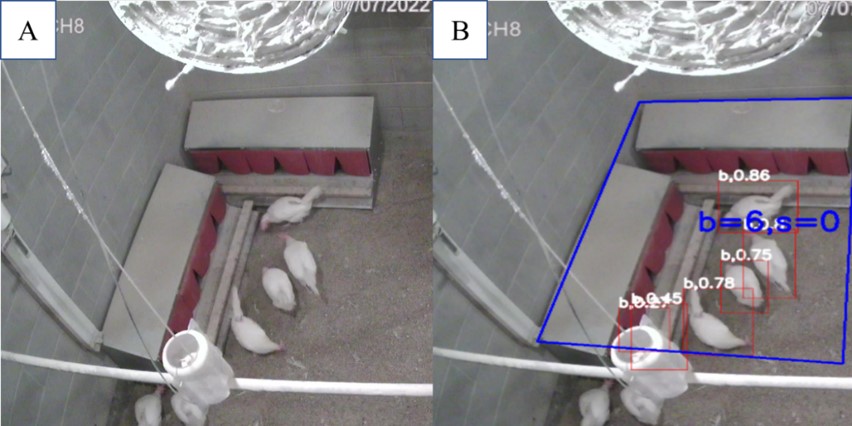
Figure 5. Chicken distribution in nesting zone: (A) original image of nesting area and (B) detected nesting area.
Summary
In this study, an improved deep learning model was developed to monitor cage – free hens’ spatial and floor distributions, including the real-time number of birds in perching zone, feeding zone, drinking zone, and nesting zone. The accuracies of the new model were 87 – 94% for all ages of chickens across zones. Birds’ age affected the performance of the model as younger birds had smaller body size and were hard to be detected due to blackness or occultation by equipment. The performance of the model was 0.891 and 0.942 for baby chicks (≤10 days old) and older birds (> 10 days) in detecting perching behaviors; 0.874 and 0.932 in detecting feeding/drinking behaviors. The current findings provide references for automatically monitoring cage – free laying hens’ spatial distribution in all age level (from baby chicks to hens). More future chicken behavior identification works could be combined with the model to reach an automatic detection system.
Further reading:
Yang, X., Bist, R.B., Subedi, S., Chai, L (2023). A deep learning method for monitoring spatial distribution of cage-free hens. Artificial Intelligence in Agriculture, 8, 20-29.