Daily routine evaluation of chickens (e.g., broilers and layers) are critical for maintaining animals’ health and welfare in commercial poultry houses. For laying hen production, it is becoming more challenging under cage–free production systems (Figure 1) as compare to conventional caged hens (Figure 2) because birds have freedoms to move in a larger space and perform some natural behaviors the litter floor such as dustbathing and foraging. In recent years, computer vision has been used to monitor farm animals considering the benefit of non-invasive. In using computer vision, cameras or ground robots are used to collect images or videos of animals (i.e., cattle, pig, and poultry). Collected data (i.e., images and videos) are analyed with machine learning or deep learning models, which need to be specifically programmed for extracting object features (e.g., chickens’ profile and body features) and predict the target class, and thus determine the accuracy of the classification. However, most of these deep learning methods for poultry detection are focused on broilers. Few studies were investigated cage-free layers. With the increasing of cage-free systems in USA and EU countries, it is critical to develop an automatic method for detecting laying hens on the litter floor of cage-free houses.
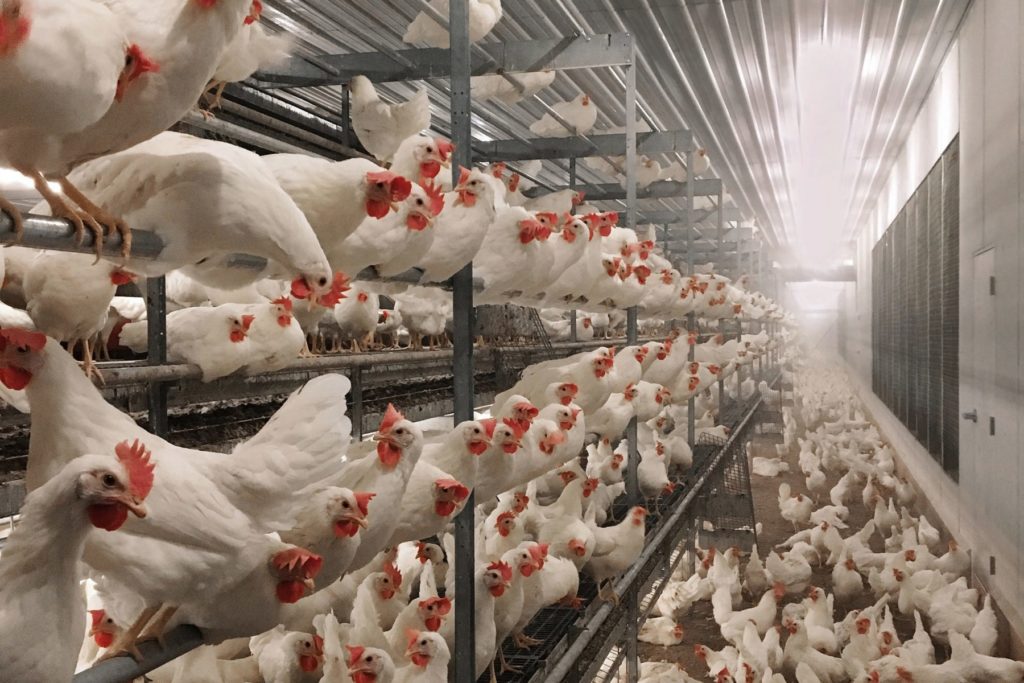
Figure 1. Cage-free hen house (photo credit: Vencomatic Group).
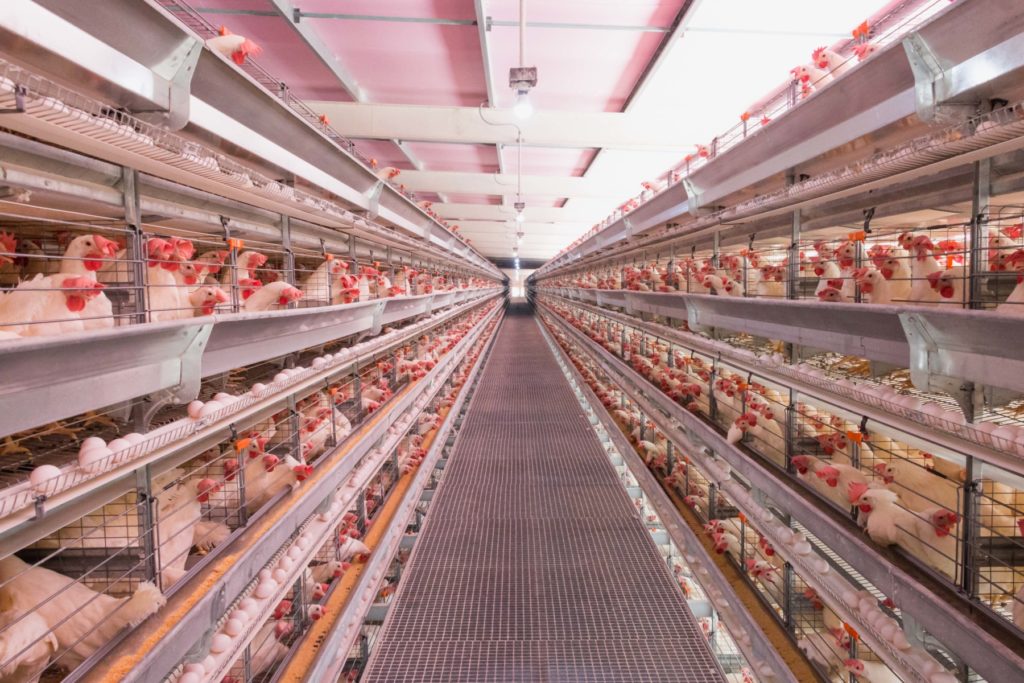
Figure 2. Conventional cage (manure belt) hen house (photo credit: Big Dutchman).
Machine Vision System Development at UGA
Experimental facilities
To develop automatic imaging system for tracking laying hens on the litter floor, 800 Hy-Line W-36 laying hens are reared evenly in the four rooms (Figure 3; each was measured as 24 ft long, 20 ft wide, and 10 ft high) on the UGA Research Poultry Farm. Water proof HD cameras (Figure 2) were installed at the ceiling and the side wall in each room to collect chickens’ video data. To protect the lens glasses and record clear video, lens cleaning cloth was used to wipe dust and keep lens glasses clean periodically (weekly). Footage data was saved on video recorder temporarily on the farm and transferred to massive hard drives for storage in the data hub in the Department of Poultry Science at the University of Georgia timely.
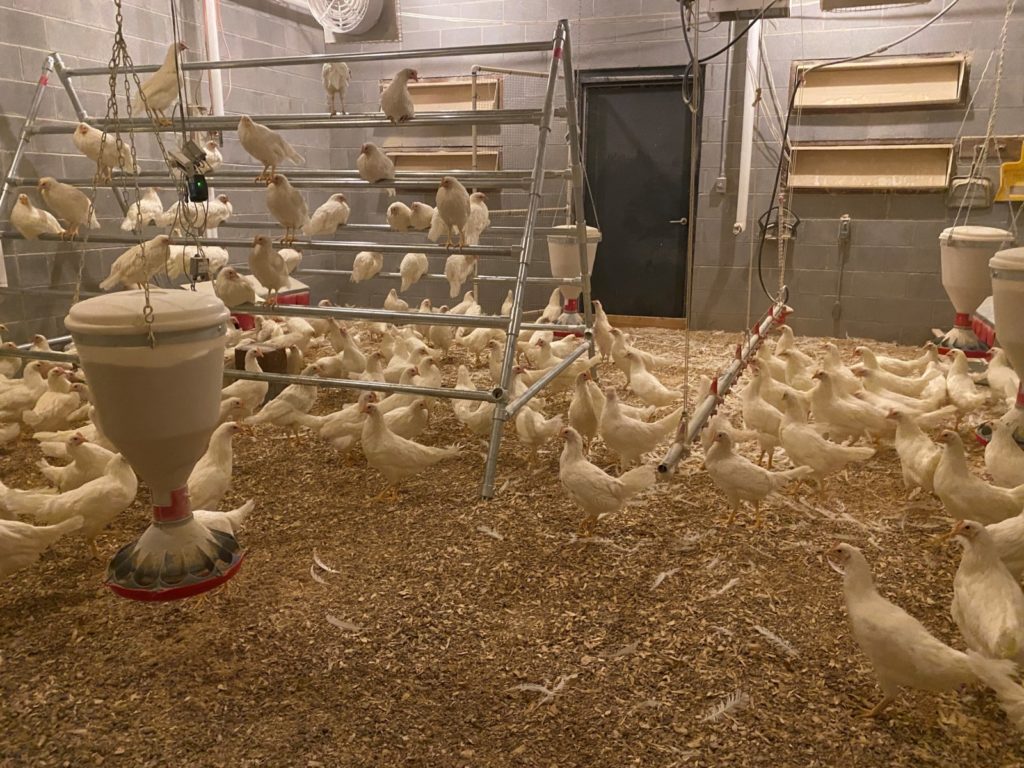
Figure 3. Research cage-free facility (24 ft long, 20 ft wide, and 10 ft high).
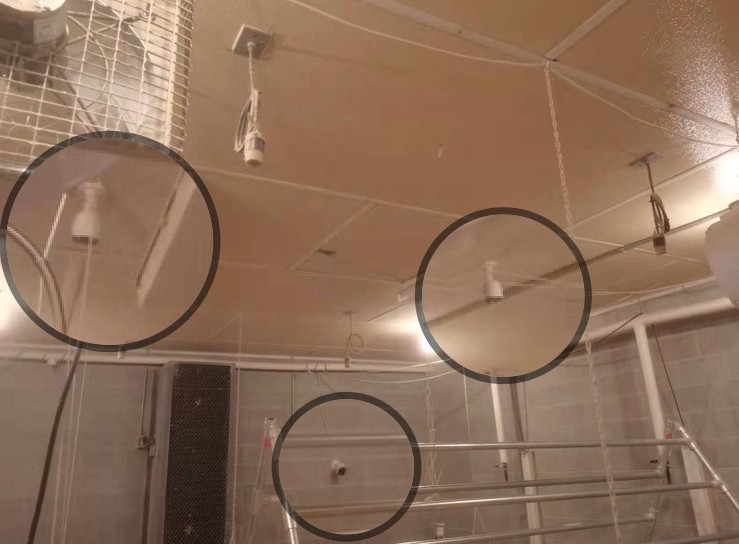
Figure 4. Monitoring cameras.
Data Analysis Model
Videos recorded at birds’ age of 8-16 weeks (as this is a transition period from pullet to layers) were used for data analysis to make sure the method would be applicable for both hens and pullets. After removing blurred imagines, about 1200 photos were labeled for model training and test (Figure 5).
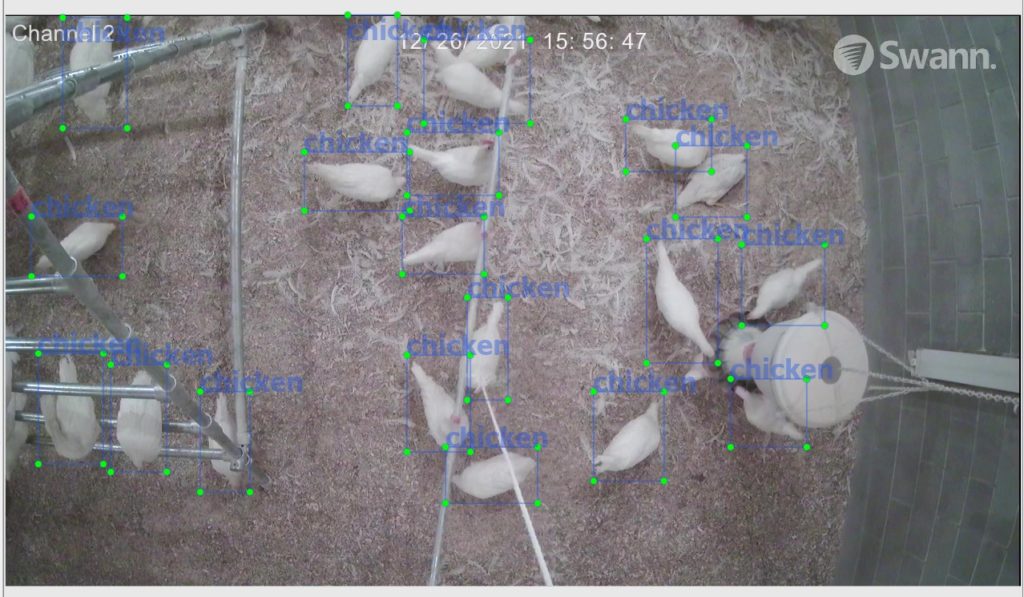
Figure 5. Image labeling for hens on the floor.
The YOLOv5x model was adapted and innovated by integrating hens’ image information as a new model “YOLOv5x-hens” for detecting birds on the litter floor. The YOLOv5x model is one of the four most commonly used models for object detection in YOLOv5, which is a newer version of YOLO (You only look once) model, a deep learning-based object detection algorithm.
Performance of the Deep Learning Models
Impact of lighting on the model
200 photos were used to test the performance of YOLOv5x-hens under different levels of light intensity (10 lux and 30 lux; Figure 6). The accuracies at 10 lux and 30 lux are 95.15% and 95.02%, respectively.
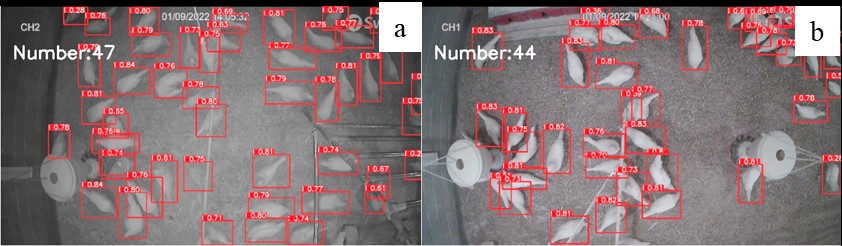
Figure 6. Number of chickens identified under different level of light intensity by our model:10 lux (a) vs. 30 lux (b).
Impact of birds’ density on the model
About 300 photos were used to test model accuracy under different levels of flock density (Figures 7 and 8): of low density (0–5 birds/m2), moderate density (5–9 birds/m2), and high density (9–18 bird/m2). For the three different densities, there was no difference in accuracies under low and middle densities (95.60% and 95.58%).
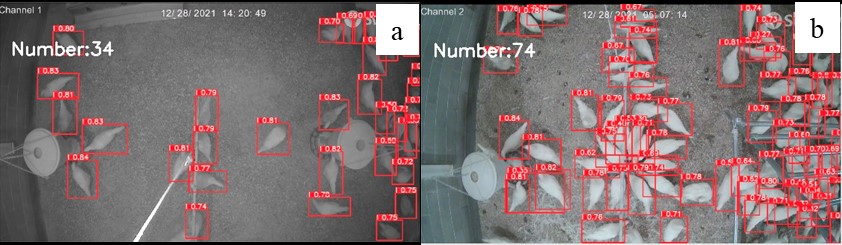
Figure 7. Number of chickens identified under low density and moderate density by our model: low density (a) vs. moderate density (b).
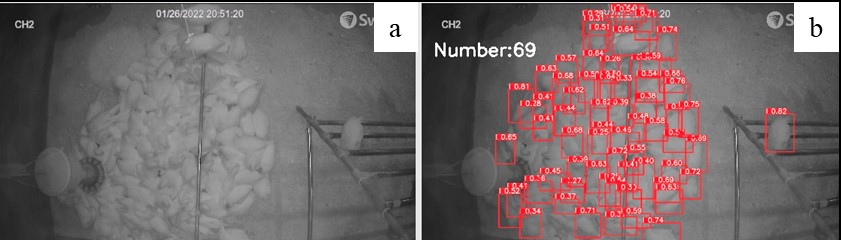
Figure 8. Number of chickens identified under high density by our model: original image of high density (a) vs. identified high density (b).
Impact of cameras’ angle on the model
In the current study, cameras were installed on the ceiling (vertical angle) and sidewall (horizontal angle). A total of 200 images were used for evaluating the effect of angles on image quality. The model performances between these two angels are slightly different. It performed better with vertical (96.33%) than horizontal (82.24%) monitoring angles (Figure 9).
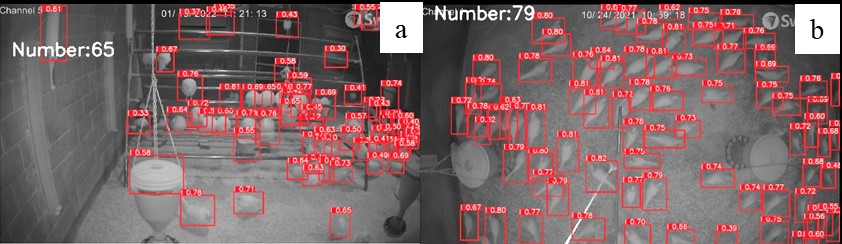
Figure 9. Number of chickens identified under horizontal angle and vertical angle by our model: horizontal angle (a) and vertical angle (b).
Summary
In this study, a machine vision system and deep learning model YOLOv5x-hens was built and evaluated at the University of Georgia research cage-free hen houses to track hens (e.g., real-time number of hens in different locations) on the litter floor. The YOLOv5x-hens model performed efficiently in real-time detection under different lighting intensities, angles, bird density, and ages over 8 weeks. However, some misidentifications happened due to the hens pilling on the floor, uneven light intensity, and images occluded by equipment (i.e., drinking line and feeder). Further research will be conducted to address those issues such as higher bird density and more occultations to mimic the situation in the commercial cage-free houses.
Further reading
Yang, X., Chai, L., Bist, R. B., Subedi, S., & Wu, Z. (2022). A Deep Learning Model for Detecting Cage-Free Hens on the Litter Floor. Animals, 12(15), 1983.
Video: